Garmin Health Announces Sleep Study Results
Garmin announced Advanced Sleep Monitoring, an enhanced capability to more accurately identify sleep stages, last June. Developed against truth data generated by a clinical device, the feature is the result of a sleep study by Garmin Health conducted under the supervision of Dr. Suzanne Stevens, Director of the University of Kansas Medical Center (KUMC) Sleep Medicine Clinic with certifications by the American Board of Psychiatry and Neurology and the American Board of Sleep Medicine.
Dr. Stevens presented the details of the study on May 7th at the Annual Meeting of the American Academy of Neurology. The poster presentation covered study design, results, and the conclusion that Garmin wearables that support Advanced Sleep Monitoring present a valid method to estimate sleep stages. For consumers, this results in invaluable insights regarding their sleep hygiene and how their sleep patterns may be affecting their overall health. For researchers, the results indicate Garmin sleep tracking wearables may be suitable for longitudinal studies where monitoring participant activity and sleep patterns are desired endpoints.
In contrast to similar studies, the Garmin Health and KUMC study was conducted outside a sleep clinic in real-world conditions typical for most users. Study participants used a clinical reference device at home in their own beds, providing data representative of their normal sleeping patterns. Only participants using CPAP machines or with tattoos on their wrist were excluded, meaning data was collected from participants with a variety of known and unknown sleeping conditions, as would generally be the case for users of consumer wearables.
Outside of the study, algorithm performance from 3,200 nights of sleep in a production environment collected during beta testing was cross-checked with clinical reference data regarding the average distribution of sleep stages by age group. The results aligned with expectations, including a decrease of deep sleep and total sleep duration as a function of age.
Garmin Health provides enterprise solutions that leverage Garmin wearables and the high-quality sensor data they produce for use in the corporate wellness, population health, and patient monitoring markets. Contact us to request more information about how to build your own innovative experience or research study.
Commercially Available Wearable
Provides Valid Estimate of Sleep Stages
Scott Burgett1,Robert Blair1, Darrell Lightfoot2, Catherine Siengsukon3, Adam Reetz1, Suzanne Stevens2
1Garmin International, 2Neurology, University of Kansas Health Systems, 3University of Kansas Medical Center
Introduction
In the last several years there has been an explosion of smart wearable devices that are capable of measuring steps, activity, heart rate, and other biometric data about the wearer. An estimated 117 million smart wearables will be sold in 2019, with that number rising to 233 million in 2022 [1]. Actigraphy has been the gold standard for many years to estimate sleep stages using wearables. Actigraphy uses accelerometer information to estimate wake/sleep periods of the user [2]. Many modern wearables also measure heart rate and heart rate variability by using optical photoplethysmography (PPG). PPG uses light emitted into the skin to measure pulse rate by observing small changes in the intensity of the reflected light due to capillary blood volume changes as the pulse pressure wave transits the sensor field of view. The use of actigraphy, heart rate, and heart rate variability together provides the opportunity to estimate more than just wake/sleep, such as light (N1 and N2), deep, and REM stages of sleep.
Although many wearables purport to accurately distinguish between light and deep sleep [3], little information is available on the validity of using wearables in this manner. A previous study by Fitbit described a non-production method to estimate sleep stages in a healthy adult population using PPG and actigraphy in a wearable device [4]. This study describes the method and results of using optical PPG and actigraphy in a wearable device (a vivosmart 3 manufactured by Garmin International) to estimate sleep stages in a population of adults.
Method
This study involved recruiting subjects to wear a Garmin vívosmart 3 and a reference device so that the accuracy of the Garmin device in estimating sleep stages could be assessed. The most accurate method to determine sleep stages involves the use of in-laboratory polysomnography (PSG), which includes the use of EEG, EOG, and EMG sensors. However, the use of an in-laboratory PSG is cumbersome for the subjects, and many times does not yield the same quality and quantity of sleep as a subject sleeping in familiar surroundings in their own bed. EEG systems that are take home devices such as the Sleep Profiler have been developed and yield comparable sleep architecture estimates to PSG [5]. In this study, the Sleep Profiler was used as the reference device, reducing burden on study participants and allowing for data collection in an environment identical to production use of the Garmin wearable. The accuracy of the Sleep Profiler was deemed to be comparable to a laboratory PSG.
Individuals in the study were trained on use of the Sleep Profiler device and directed to wear the Garmin device on the nondominant wrist. The Sleep Profiler device recorded three channel EEG for sleep staging (as well as other measurements such as heart rate). The Garmin device logged data simultaneously with the Sleep Profiler. Accelerometer x, y, and z channels were recorded, along with the wide bandwidth PPG signal. Only the green channel was used in this study. Data was time aligned to within a second by setting the internal clocks of both devices to the same time, and then comparing the heart rate output of the Garmin device to the heart rate output of the Sleep Profiler, as these two measurements were very similar, highly correlated, and yielded time alignments of better than one second.
The Sleep Profiler output data, including the automated sleep staging output, was then reviewed by a Registered Polysomnographic Technologist using AASM guidelines [6] to provide the reference sleep stages. Scoring was done at the 30-second epoch level. In this case, N1 and N2 sleep stages were combined into a light sleep category. Wake, light, deep (N3) and REM stages were then scored.
The scored data was then used to train a neural network to perform the sleep stage classification. The neural network architecture was chosen such that it could be realized in a production system that included the wearable device, with somewhat limited computing resources, and the Garmin cloud, which has extensive computing resources. In the end, a two-stage approach was used, where data was pre-processed on the wearable to segment and compress the wide bandwidth sensor data into a manageable payload for syncing off the device via Bluetooth low energy (BLE) and the Garmin Connect Mobile app to the Garmin cloud for further processing.
The neural network used in the cloud was an adaptation and simplification of the architecture of Zhao [7]. Over 60 features were computed on the device. Seven more features were computed on the cloud over the entire night’s data.
The network was trained using a k-fold cross validation re-sampling procedure with a k value of five [8]. In this method, the data was randomly sampled into five equally sized groups. The network was trained on four of the groups (80%), and scored on remaining group (20%). The training set was randomly subdivided into a training set and a validation set used to determine when to stop training the network. The stopping criteria used was a variation of the criteria given in [9]. This method was repeated five times such that each subject was used four times in the training set, and one time in the test set.
Results
55 individuals were recruited to participate in the study. The only exclusion criterion was if there was a tattoo on the dorsum of wrist that would interfere with the optical heart rate reading. Of these 55 individuals, 14 indicated that they have a sleep disorder or take medications that may impact sleep architecture. These individuals were noted, however their data was still included in the study to represent the general population and a percentage of real-world users with sleep disorders, whether known or unknown. Of the 55 participants, 31% (17) were female and 69% (38) were male. Age distribution was 35.5 +/- 8.7 years, BMI distribution was 26.3 +/-6.4.
The overall accuracy of the algorithm against this real-world data was 69.7%, with the sensitivity in detecting sleep 95.8% and the specificity in detecting awake 73.4% (Table 1). The Cohen’s kappa (k) value is 0.54 +/- 0.12. These results should be assessed in light of the fact that the inter-scorer agreement between two trained human scorers using PSG is approximately 83% [10] with a Cohen’s kappa of approximately 0.78 [4].
Table 1. Sensitivity, Specificity, Accuracy, and
Cohen’s Kappa of Wearable Sleep Stage Classifier
| Sensitivity | 95.8% |
| Specificity | 73.4% |
| Overall accuracy (correctly classifying sleep stage) | 69.7% |
| Cohen’s kappa | 0.54 +/- 0.12 |
The full confusion matrix for the sleep stage classifier is given in Table 2. The matrix shows that that the classifier predicts deep, light, and REM sleep stages at roughly the same 69% accuracy rate. Wake is slightly more accurate at 73%. The most common mis-classifications are classifying true deep sleep as light sleep and classifying true REM sleep as light sleep.
Table 2. Confusion Matrix for All Participants
True Stage vs. Predicted Stage
| True Deep | True Light | True REM | True Awake | |
| Predicted Deep | 68.9% | 12.0% | 1.4% | 1.9% |
| Predicted Light | 29.1% | 68.6% | 26.4% | 14.9% |
| Predicted REM | 0.9% | 13.7% | 69.8% | 9.7% |
| Predicted Awake | 1.1% | 5.7% | 2.3% | 73.4% |
A comparison between the reference device and the wearable device of the overall sleep architecture for all 55 participants is given in Table 3.
Table 3. Sleep Architecture for All Participants
| % Deep | % Light | % REM | % Awake | |
| Garmin Wearable |
15.5% | 46.0% | 21.6% | 16.9% |
| Sleep Profiler |
12.7% | 50.7% | 18.3% | 18.3% |
It is important to note that the algorithm described in this paper was deployed into production on many Garmin wearable devices, including the vívosmart 3. During beta testing of the production implementation of the wearable sleep stage classifier, an additional 3,200 nights of data were analyzed and reviewed to ensure the results aligned with those of the 55-person study. There was no accompanying reference device data with these 3200 nights – only the production implementation using actigraphy and optical heart rate was used. On this larger cohort, the distribution of sleep stages as a function of age was used to assess algorithm performance. REM sleep distribution remained relatively constant as a function of age, deep sleep decreased markedly as a function of age, and total sleep time generally decreased with age – as expected [11].
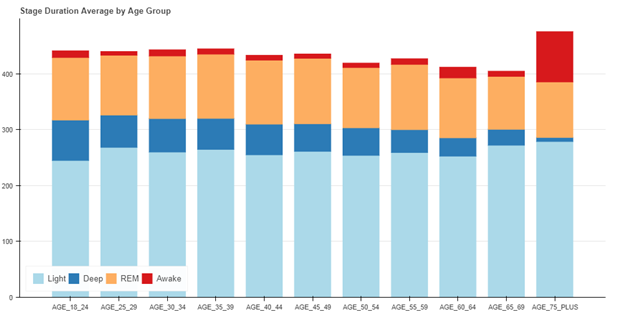
Figure 1. Sleep Duration – Average by Age Group in Production System
Finally, some representative results from the cohort of 55 subjects are shown below. In the following figures, wake is represented as stage 3, REM as stage 2, light (N1 and N2) as stage 1, and deep as stage 0. Figure 2 shows the median result (27th of the 55 data sets when rank ordered by accuracy), with an accuracy of 71.5%.
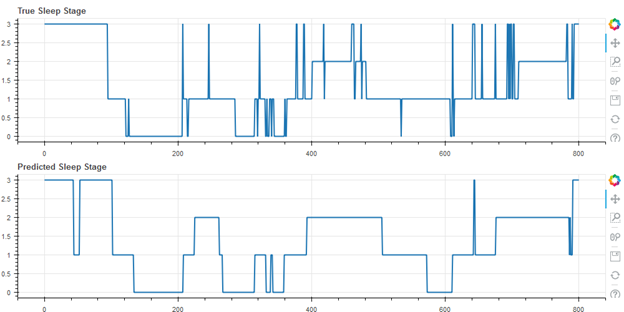
Figure 3 shows the best result of the cohort (first of 55), with an accuracy of 80.1%
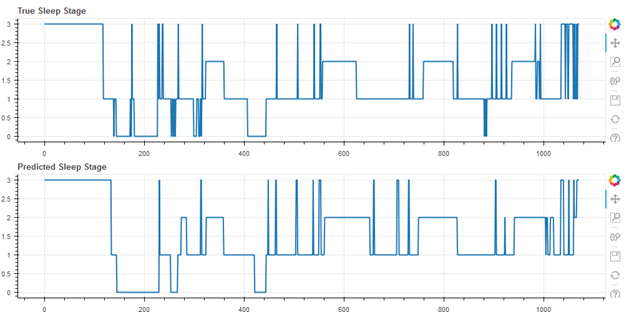
Figure 3. Best Result, Accuracy 80.1%, Cohen’s Kappa 0.70
Figure 4 shows the worst result of the cohort (55 of 55), with an accuracy of 49.9%. Note that this user self-reported having a sleep disorder.
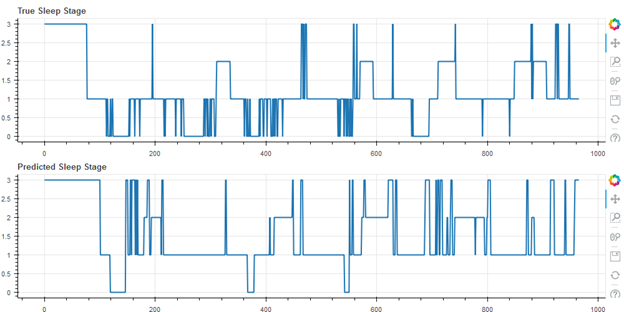
Figure 4.
Worst Result, Accuracy 49.9%, Cohen’s Kappa 0.18 (Self-Reported Sleep Disorder)
Discussion
The work provides evidence that a wearable device using only actigraphy and optical heart rate sensors can estimate sleep stages of users to nearly 70% accuracy with a good Cohen’s kappa of 0.54 +/- .12. This compares closely to the results in [4], despite the increased challenges of production systems and real-world data collection. It also compares favorably, but does not reach the same level of accuracy, as EEG based sleep stage measurement devices, which reach an inter-scorer accuracy level of 82%.
The major benefit to using a wrist wearable device to estimate sleep stages is the very low level of user friction involved – a user can simply wear the device on the wrist during sleep without cumbersome, special equipment. Use of a wearable for estimating sleep stages accurately allows for monitoring of sleep for virtually an unlimited number of nights, assuming the device is kept charged during the day, providing a user with useful data about sleep hygiene and sleep architecture.
References
- P Lamkin, Smart Wearables Market to Double by 2022: $27 Billion Industry Forecast,” Forbes, October 23, 2018. [Online]. Available: https://www.forbes.com/sites/paullamkin/2018/10/23/smart-wearables-market-to-double-by-2022-27-billion-industry-forecast/#419523e92656 [Accessed April 25, 2019]
- L de Souza, AA Benedito-Silva, ML Pires, D Poyares, S Tufik, HM Calil, “Further validation of actigraphy for sleep studies,” Sleep. 2003 Feb 1;26(1):81-5.
- J Mantua, N Gravel, R M. C. Spencer, “Reliability of Sleep Measures from Four Personal Health Monitoring Devices Compared to Research-Based Actigraphy and Polysomnography,” Sensors (Basel). 2016 May; 16(5): 646.
- Z Beattie, Y Oyang, A Statan, A Ghoreyshi, A Pantelopoulos, A Russell, C Heneghan, “Estimation of sleep stages in a healthy adult population from optical plethysmography and accelerometer signals,” Physiol. Meas. 38 (2017) 1968–1979.
- P Finan, J Richards, C Gamaldo, D Han, JM Leoutsakos, R Salas, M Irwin, M Smith, Validation of a Wireless, Self-Application, Ambulatory Electroencephalographic Sleep Monitoring Device in Healthy Volunteers, J. Clin. Sleep Med. 12 1443–50.
- Berry R B, Brooks R, Gamaldo C E, Harding S M, Lloyd R M, Marcus S L, Vaughn B V 2015 The AASM Manual for the Scoring of Sleep and Associated Events: Rules, Terminology and Technical Specifications, version 2.5 (Darien, IL: American Academy of Sleep Medicine).
- M Zhao, S Yue, D Katabi, T Jaakkola, M Bianchi, “Learning Sleep Stages from Radio Signals: A Conditional Adversarial Architecture,” International Conference on Machine Learning (ICML’17).
- J. Brownlee, “A Gentle Introduction to k-fold Cross Validation”, Statistical Methods, May 23, 2018. [Online]. Available: https://machinelearningmastery.com/k-fold-cross-validation/. [Accessed April 25, 2019].
- L. Prechelt, “Early Stopping – but when”, [Online]. Available: https://page.mi.fu-berlin.de/prechelt/Biblio/stop_tricks1997.pdf. [Accessed April 25, 2019].
- R Rosenberg, S Van Hout, “The American Academy of Sleep Medicine Inter-scorer Reliability Program: Sleep Stage Scoring,” J Clin Sleep Med. 2013 Jan 15; 9(1): 81–87.
- M Ohayon, M Carskadon, C Guilleminault, M Vitiello, “Meta-Analysis of Quantitative Sleep Parameters From Childhood to Old Age in Healthy Individuals: Developing Normative Sleep Values Across the Human Lifespan,” Sleep, 2004, 27(7):1255-73.
The post Garmin Health Announces Sleep Study Results appeared first on Garmin Blog.
Sample Block Quote
Praesent vestibulum congue tellus at fringilla. Curabitur vitae semper sem, eu convallis est. Cras felis nunc commodo loremous convallis vitae interdum non nisl. Maecenas ac est sit amet augue pharetra convallis nec danos.
Sample Paragraph Text
Praesent vestibulum congue tellus at fringilla. Curabitur vitae semper sem, eu convallis est. Cras felis nunc commodo eu convallis vitae interdum non nisl. Maecenas ac est sit amet augue pharetra convallis nec danos dui.
Cras suscipit quam et turpis eleifend vitae malesuada magna congue. Damus id ullamcorper neque. Sed vitae mi a mi pretium aliquet ac sed elitos. Pellentesque nulla eros accumsan quis justo at tincidunt lobortis denimes loremous. Suspendisse vestibulum lectus in lectus volutpat, ut dapibus purus pulvinar. Vestibulum sit amet auctor ipsum.