By The Numbers: Running Across America
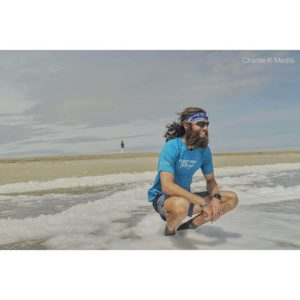
Please enjoy the guest blog post from Adam Kimble, The Bearded Sole, who ran 2,500 miles from California to Georgia in 60 days. If you missed our first post on his journey, click here.
When you spend sixty days doing any one thing, you’re certain to generate a lot of interesting statistics surrounding that activity. Running almost 2,500 miles across United States from California to Georgia is no exception. For a journey like this, our crew planned to keep track of certain things: pairs of shoes retired, most pairs of socks worn in one day and average calories consumed per day, to name a few (for those keeping score, those answers were 5, 12, and 6,400 respectively). Our hope was that we would get some pretty cool data to share.
In addition to what we planned to track, there were other figures that presented themselves along the way. If you haven’t spent much time running or walking on the side of roads, I’m here to tell you that there are plenty of interesting things to find! The very first day, I began doing something I do on a regular basis when I’m running: collecting change. It was business as usual for me to collect pennies and other change along the road, so we decided to turn the coin collection into a group fund. Every coin (or in one case, a dollar bill) was placed into a jar, and at the end of our journey we cashed it in and used it to purchase drinks for our celebration party. When it was all said and done, we had collected $18.57 in change!
Perhaps the most unexpected collector’s items from the road were license plates from each state we entered. Unfortunately, when we started in California, I had no idea this collection was going to exist. It wasn’t until Arizona that I found the first license plate on the side of the road, and from there began to look for them in every state. Of the eight states we ran through, we discovered license plates in six of them! Luckily, we have some great supporters and were offered up license plates from Mississippi and California. Now the collection is complete! Reflecting on this collection, I still can’t help but wonder “how did these license plates wind up on the side of the road?”
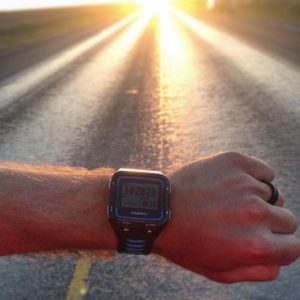
Ultimately, however, it was the running specific statistics that truly captured the magnitude of our journey. Thankfully, we had the support of the Garmin Forerunner 920XT for GPS tracking and Garmin Connect to sync up and record the data for us. Below is a snapshot of what the adventure looked like from the perspective of my watch:
Overall miles (Huntington Beach to Tybee Island): 2,484.1
Average miles per day: 45.2
Most miles in one day: 76.3
Most miles in one week: 347.4
Fastest Half-Marathon (including breaks): 2:34:42
Fastest Marathon (including breaks): 5:53:31
Total steps taken: 3,699,213
At the end of the day, what do all of these numbers tell us? They tell us that sixty days of repetitive physical action can produce some interesting data points! But there’s another part of the story they don’t tell us. They don’t tell of the countless memories made on the road, the beauty of every day’s sunrise and sunset, the lifelong friends made across the country, and the immeasurable support we received from thousands of our followers across the world!
The post By The Numbers: Running Across America appeared first on Garmin Blog.
Sample Block Quote
Praesent vestibulum congue tellus at fringilla. Curabitur vitae semper sem, eu convallis est. Cras felis nunc commodo loremous convallis vitae interdum non nisl. Maecenas ac est sit amet augue pharetra convallis nec danos.
Sample Paragraph Text
Praesent vestibulum congue tellus at fringilla. Curabitur vitae semper sem, eu convallis est. Cras felis nunc commodo eu convallis vitae interdum non nisl. Maecenas ac est sit amet augue pharetra convallis nec danos dui.
Cras suscipit quam et turpis eleifend vitae malesuada magna congue. Damus id ullamcorper neque. Sed vitae mi a mi pretium aliquet ac sed elitos. Pellentesque nulla eros accumsan quis justo at tincidunt lobortis denimes loremous. Suspendisse vestibulum lectus in lectus volutpat, ut dapibus purus pulvinar. Vestibulum sit amet auctor ipsum.